Jupyter Interface (Interactive)
GRACE-HPC also supports a fully interactive, user friendly Jupyter Notebook interface, allowing you to enter the arguments through intuitive widgets and instantly visualise the results. Interactive figures are created using plotly providing in-depth insights into the energy and carbon emissions of the users HPC jobs - all within a single .ipynb file.
💡 You must have generated, edited, and saved the
hpc_config.yamlconfiguration file before completing the steps below.
Setting Up the .ipynb Notebook
Launch a
.ipynbnotebook on your HPC system.Ensure the notebook is launched from and running in the ghpc_env environment, where the gracehpc package is installed.
There are many ways to run .ipynb notebooks. We recommend using VS Code or JupyterLab for the best experience.
For Isambard Systems
If you’re working on Isambard 3 or Isambard-AI, follow this guide to start a JupyterLab session on a compute node: JupyterLab Guide
Be sure to use your own
ghpc_envenvironment instead of the providedjupyter-user-environment. Remember to update the environment name in your job submission script.
Isambard-AI submission script:
#!/bin/bash
#SBATCH --job-name=jupyter_user_session
#SBATCH --gpus=1  # this also allocates 72 CPU cores and 115GB memory
#SBATCH --time=01:00:00

# Make sure this is the environment with GRACE-HPC installed
source ~/miniforge3/bin/activate ghpc_env

# Add pre-installed kernelspecs to the Jupyter data search path
export JUPYTER_PATH="/tools/brics/jupyter/jupyter_data${JUPYTER_PATH:+:}${JUPYTER_PATH:-}"

HSN_FQDN="$(hostname).hsn.ai-p1.isambard.ac.uk"
LISTEN_IP=$(dig "${HSN_FQDN}" A +short | tail -n 1)
LISTEN_PORT=8888

set -o xtrace
jupyter lab --no-browser --ip="${LISTEN_IP}" --port="${LISTEN_PORT}"
Alternatively, you can use the tool in a .ipynb file using VS Code directly on the login node, or follow this guide to start an interactive VS Code session on a compute node: VS Code Guide
Launch the Interface
Once your .ipynb notebook is open and connected to the ghpc_env environment, your ready to launch the interactive interface:
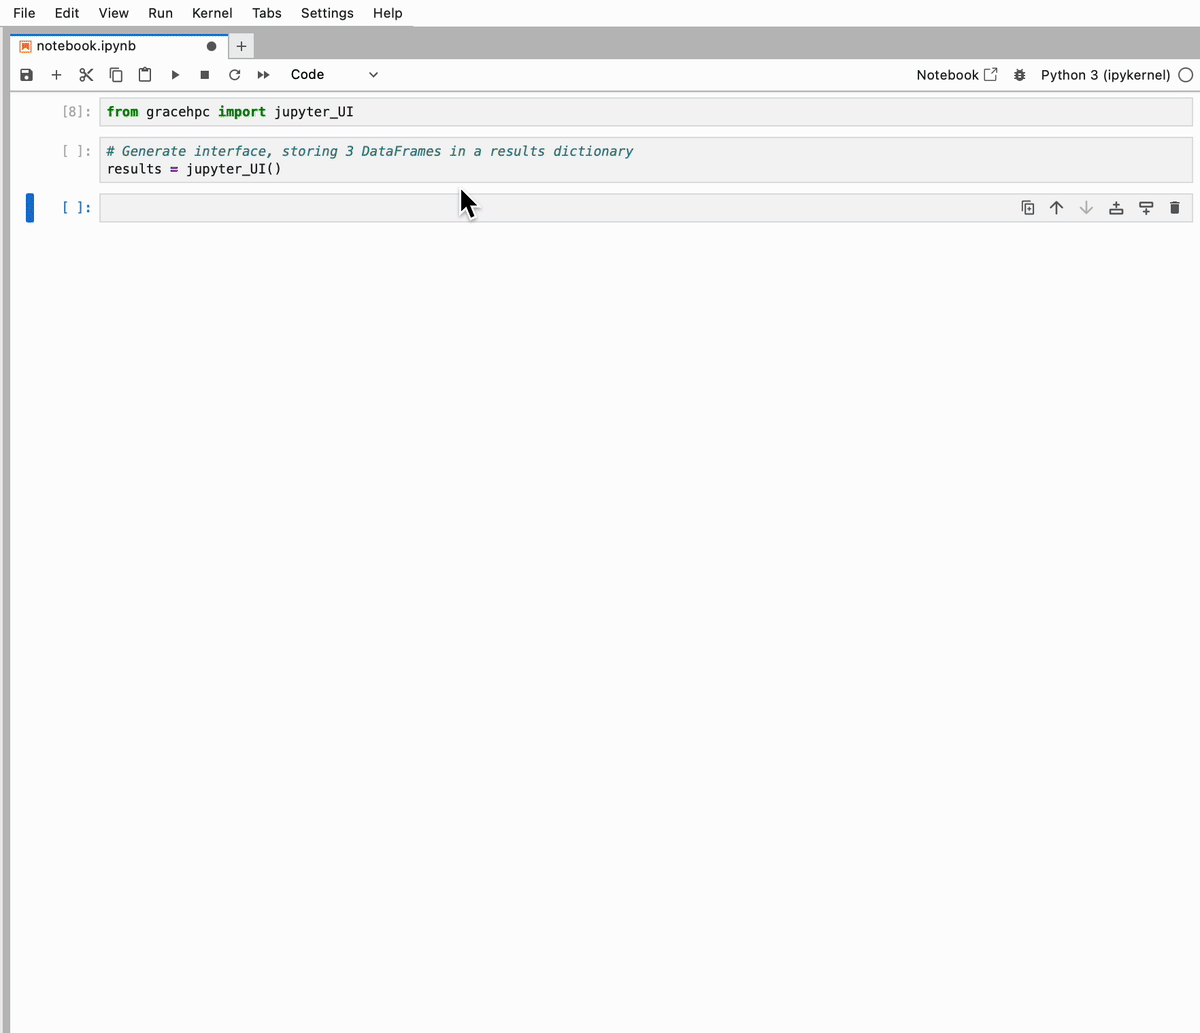
from gracehpc import jupyter_UI

# Generate interface, storing 3 DataFrames in a results dictionary
results = jupyter_UI()
results is a dictionary containing the 3 DataFrames discussed in the Python Usage section:
full_df
daily_df
total_df
This allows the user to access the raw data as well as the rich notebook display. Note results will only contain the DataFrames once the Calculate Carbon Footprint button has been clicked.
The interface generated:
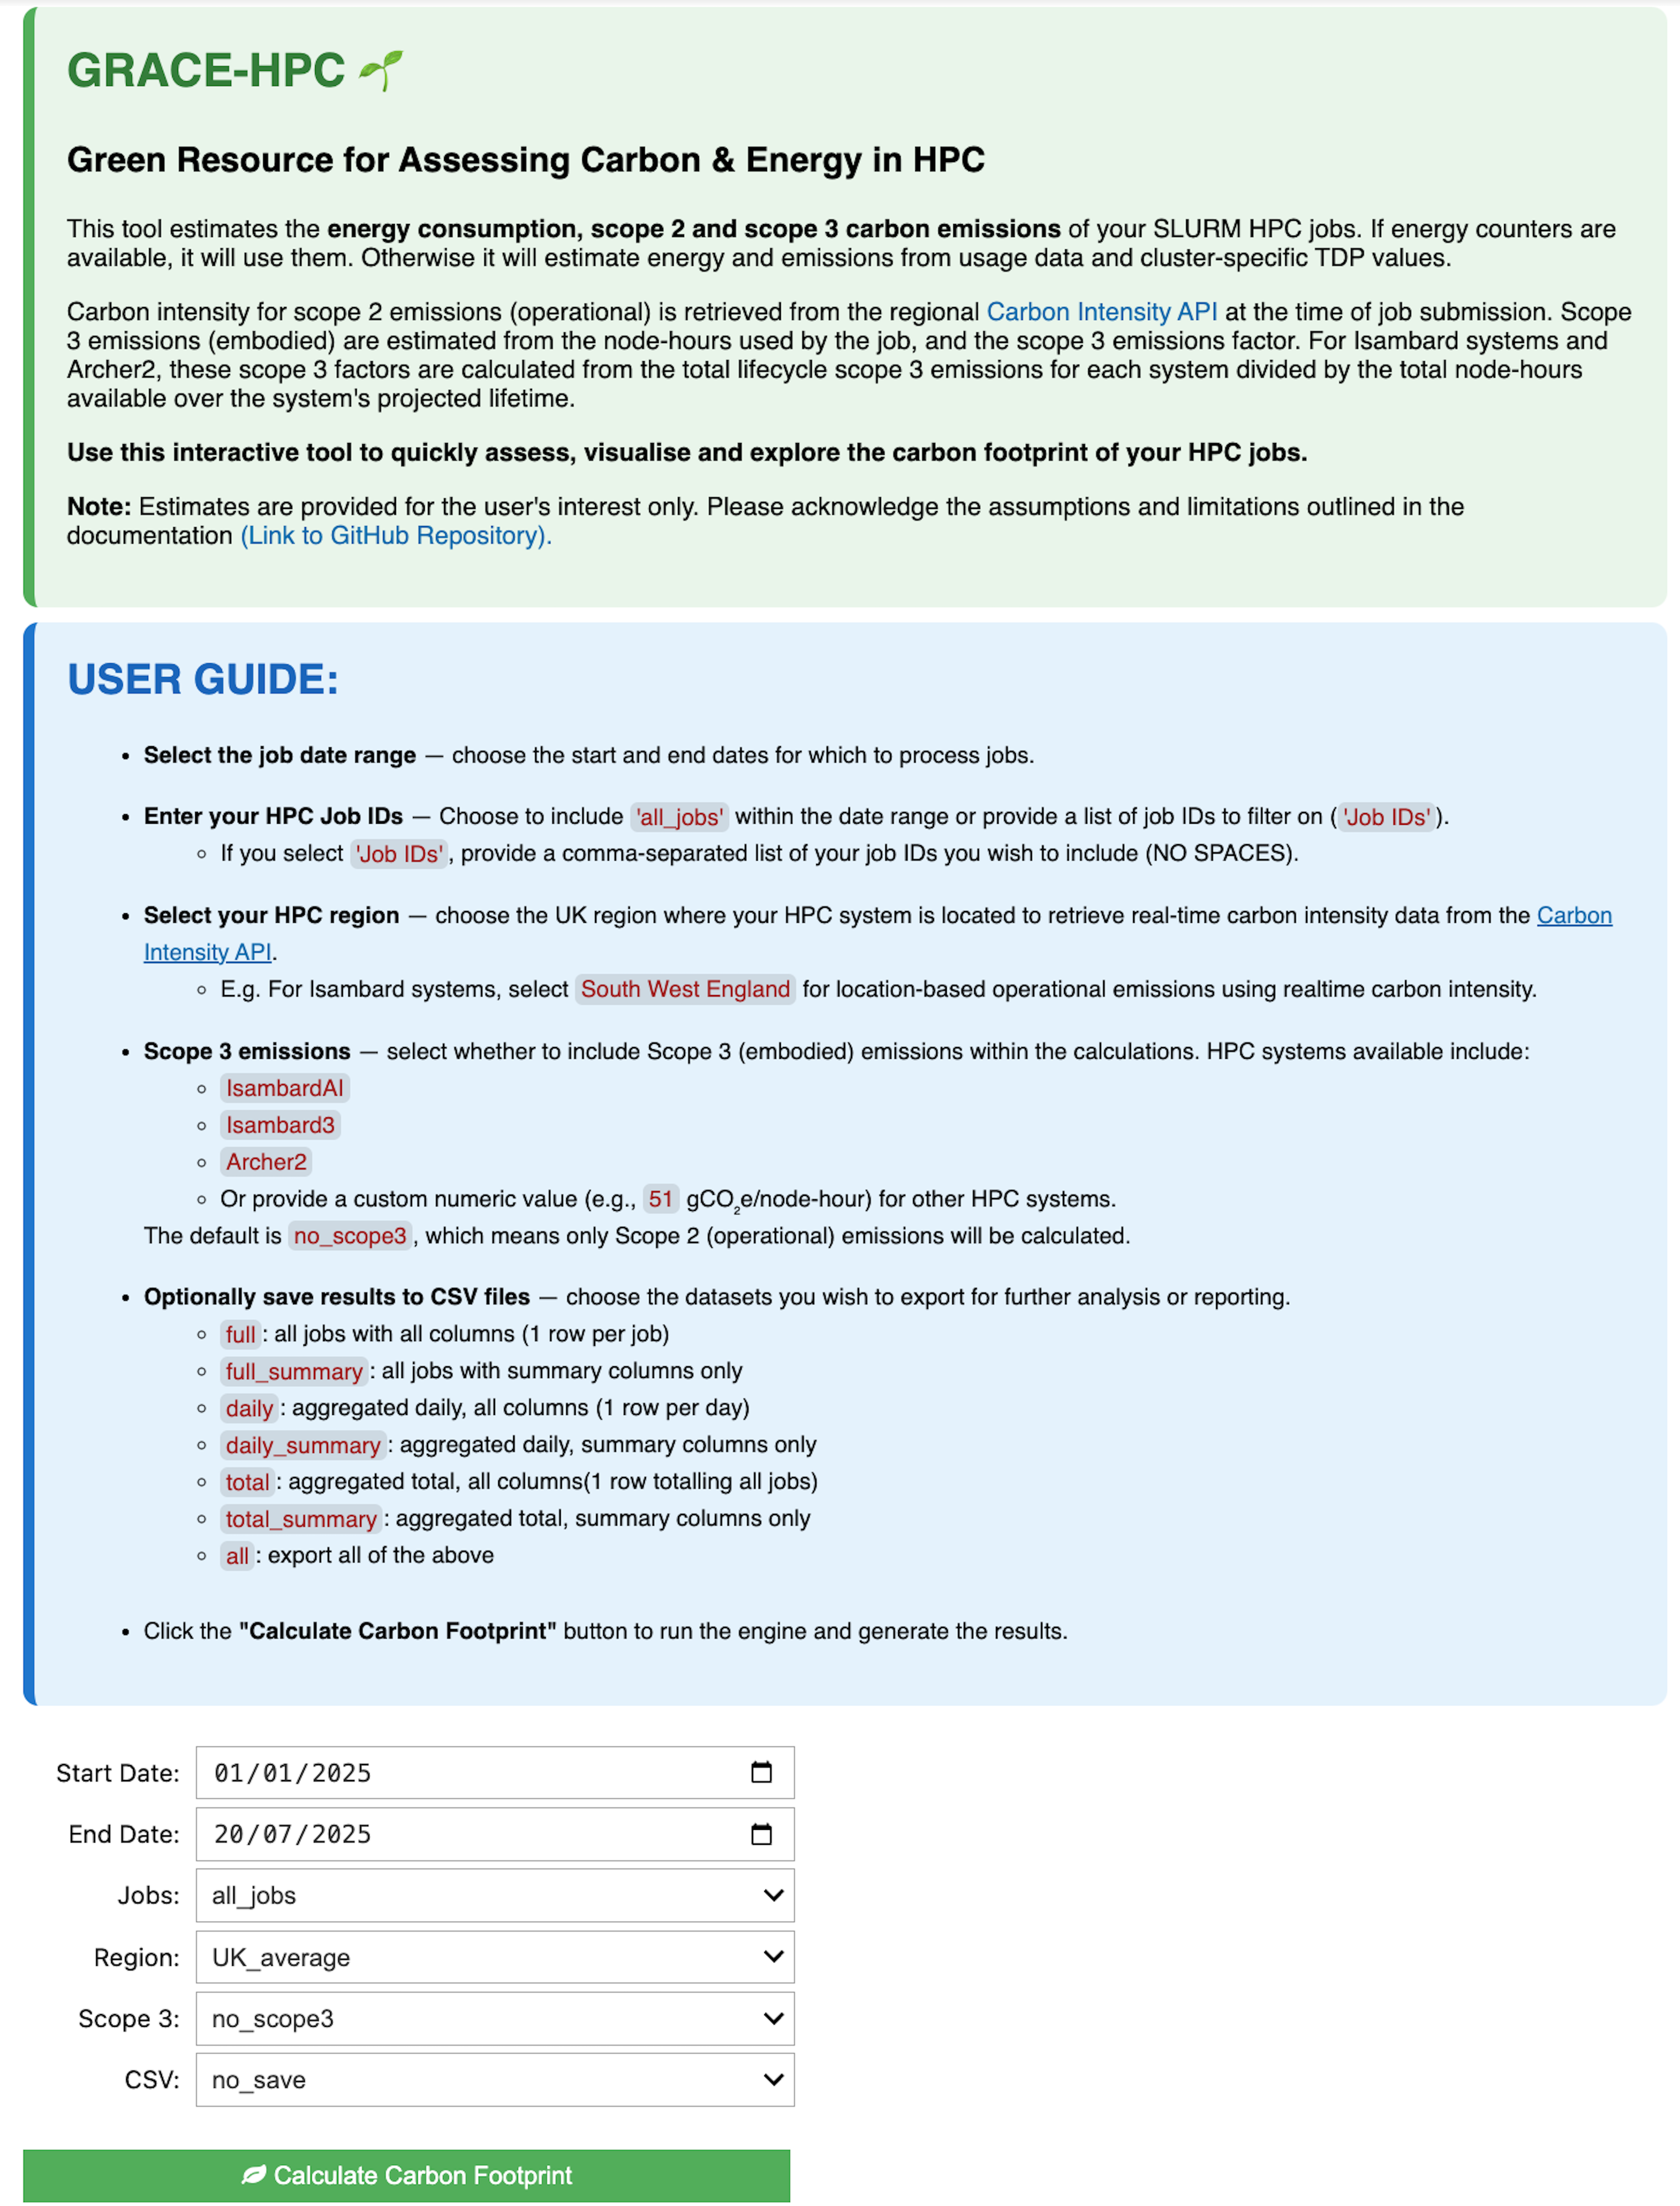
The input arguments behave in the same way as the CLI and Python Usage. Users can easily enter different parameters using the widgets and repeatedly run the tool and instantly visualise the corresponding results.
Notebook Demo
The video below demonstrates the tool in action within JupyterLab on Isambard-AI.